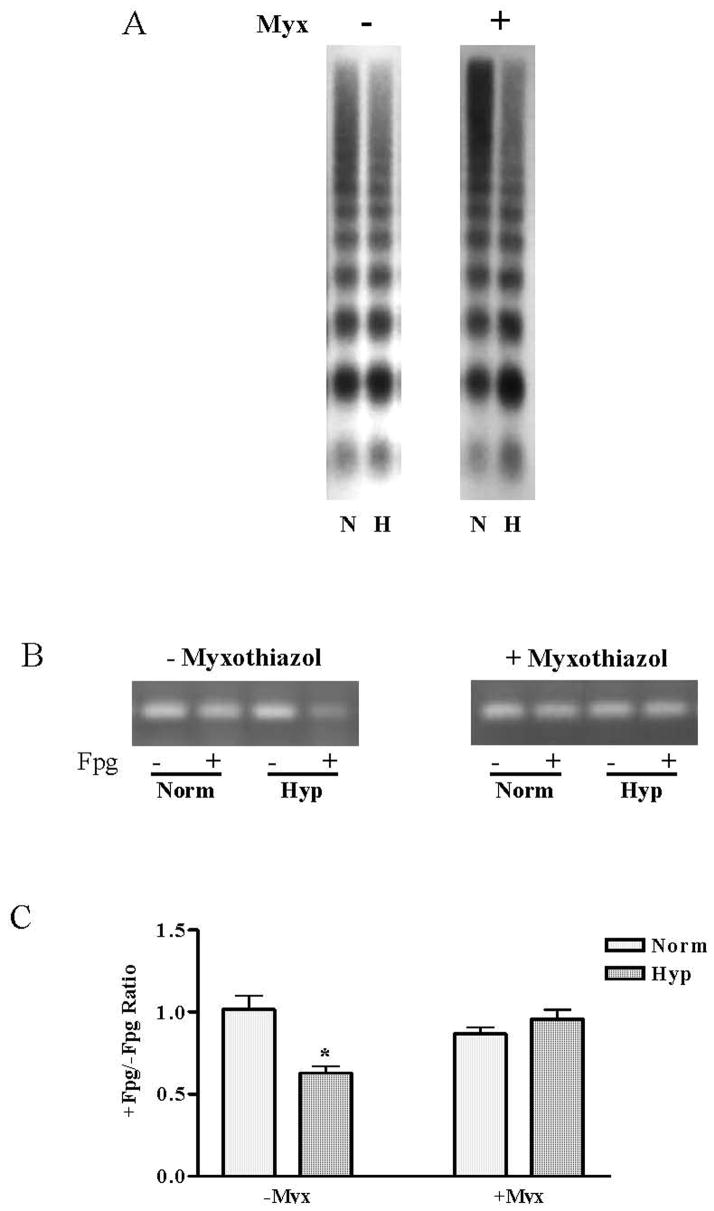
FIGURE 5.
(A) Southern blot analysis of the VEGF hypoxic response element of DNA fragments released from MN-digested (15 min) nuclei of normoxic (N) and hypoxic (H) PAECs with or without myxothiazol treatment. (B) PCR analysis of treated and untreated with Fpg DNA fragments recovered from mono-nucleosomal fraction with primers specific for the HRE of the VEGF promoter. (C) Pooled data for +/−Fpg PCR band intensity ratio. N = 6. *Different from normoxic controls at p<0.05.

