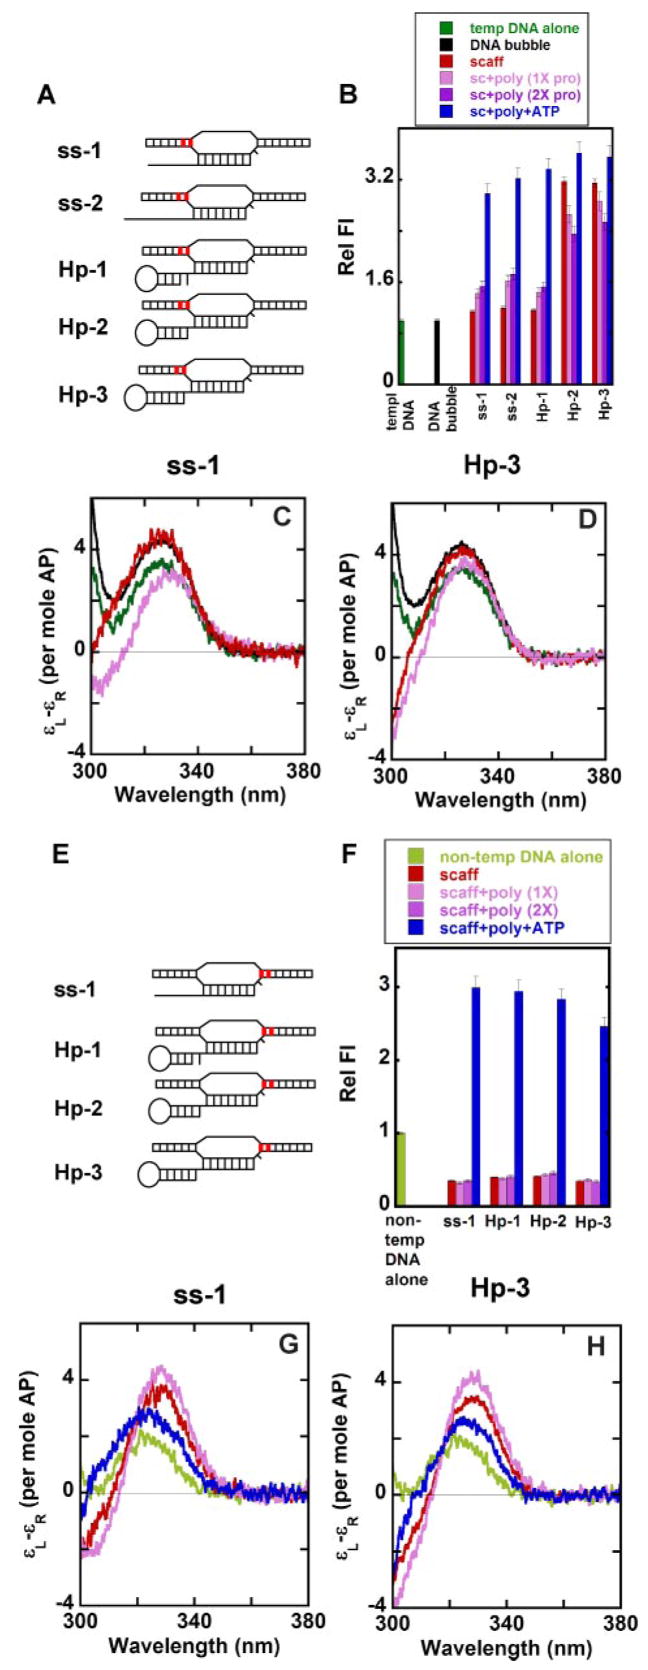
FIGURE 5. Local base conformations at the upstream and downstream ends of the noncomplementary DNA bubble of various free and RNAP-complexed nucleic acid scaffolds.
A and E, scaffolds showing the positions of the 2-AP bases (in red) in the template and non-template strands. B and F, relative fluorescence intensities. Panels C and D and panels G and H, low energy CD spectra for ss-1 and Hp-3 scaffolds, respectively. Color coding for both the CD spectra and the fluorescence intensities: dark green, single-stranded template DNA with the 2-AP bases in the template strand (A); black, DNA bubble alone with the 2-AP bases in the template strand; light green, single-stranded non-template DNA with the 2-AP bases in the non-template strand (E); red, RNA-DNA scaffold; pink, scaffold-polymerase complex at equimolar concentrations; purple, scaffold-polymerase complex with twice the concentration of RNAP; blue, scaffold-RNAP complex at equimolar concentrations and RNA extended by the addition of ATP.

