
Fig. 1.
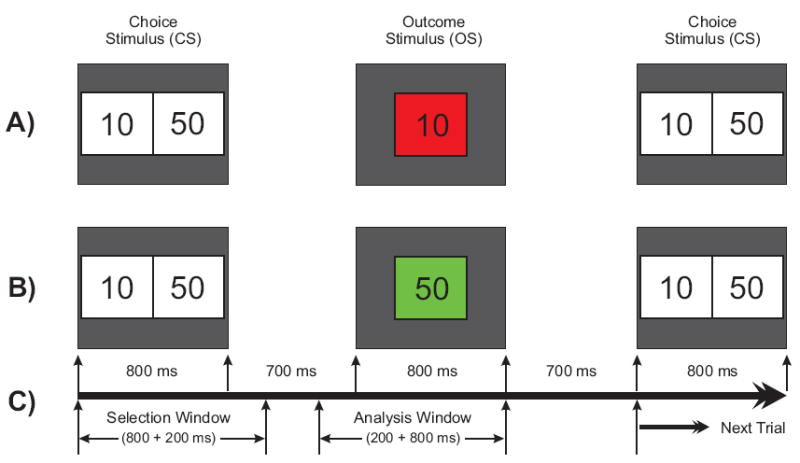
Schematic illustration of the gambling task used in this experiment. One of the two numbers (10 or 50) in the choice stimulus (800 ms) is to be selected by the subject. The selected amount appears as the outcome stimulus (800 ms) either in red (to indicate a loss) or in green (to indicate a gain). A) a typical trial showing a loss of 10 in red box; B) another trial having a gain of 50 in green box; and C) the time duration for the task events: the selection window (1000 ms) wherein the subject selects either of the numbers and the analysis window (200 ms prestimulus + 800 ms poststimulus) represents the time segment that was used for the ERP analysis.