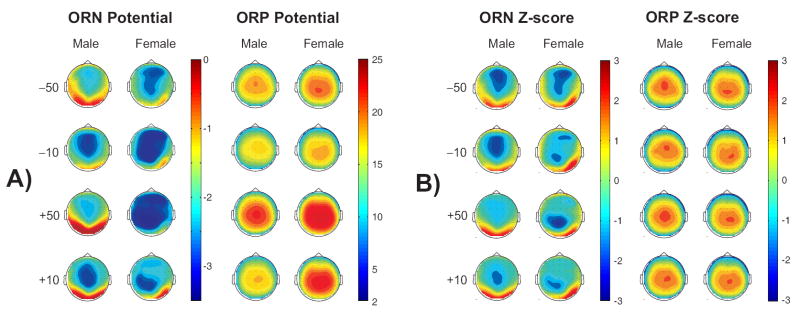
Fig. 7.
The topographic maps of ORN and ORP components at peak amplitudes (in μV). ORN component has been plotted after performing a high-pass filter at 2 Hz (only for the display of topography). The surface potentials (Panel A) and the Z-score (in numerical units) of these potentials (Panel B) are shown for both ORN and ORP components. The Z-scores, calculated across 61 electrodes for each map separately, elicit the shape of the activity by masking the amplitude differences. Therefore, the values in the color scale of Z-score maps may represent different amplitude values in each map. These maps were generated at the peak of following electrodes: 1) ORN for −50 and −10 conditions at FZ; 2) ORN for +50 and +10 conditions at CZ; 3) ORP for −50 and −10 conditions at CZ; and 4) ORP (for +50 and +10 conditions) at PZ.

