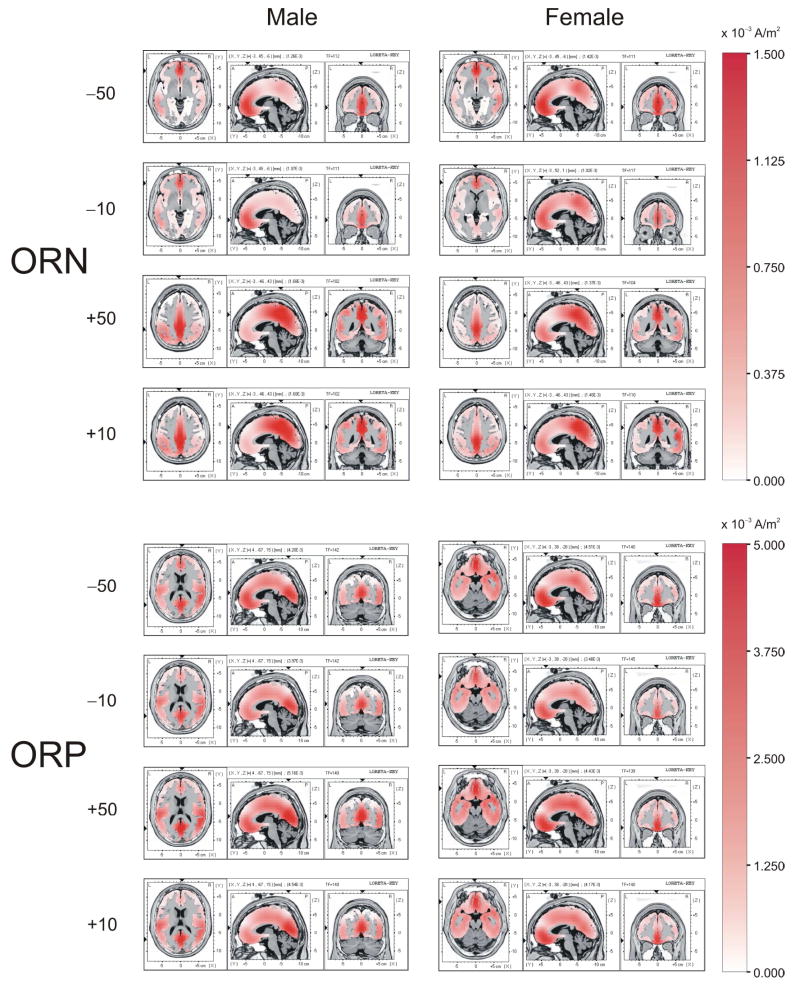
Fig. 8.
LORETA images for the ORN and ORP components at the peak amplitudes in male and female groups. During the ORN activity, the maximum activity for the loss is in medial frontal areas while the maximum activity for the gain is in medial posterior areas in both males and females, although females activate both anterior as well as posterior areas in all conditions. During the ORP activity, females had the maximum activity in anterior areas whereas males had the highest activity in posterior areas. The axial slices differ between males and females because they were derived from the maximum current density for each gender. The color intensity scale shows current density in ampere per square meter (A/m2).

