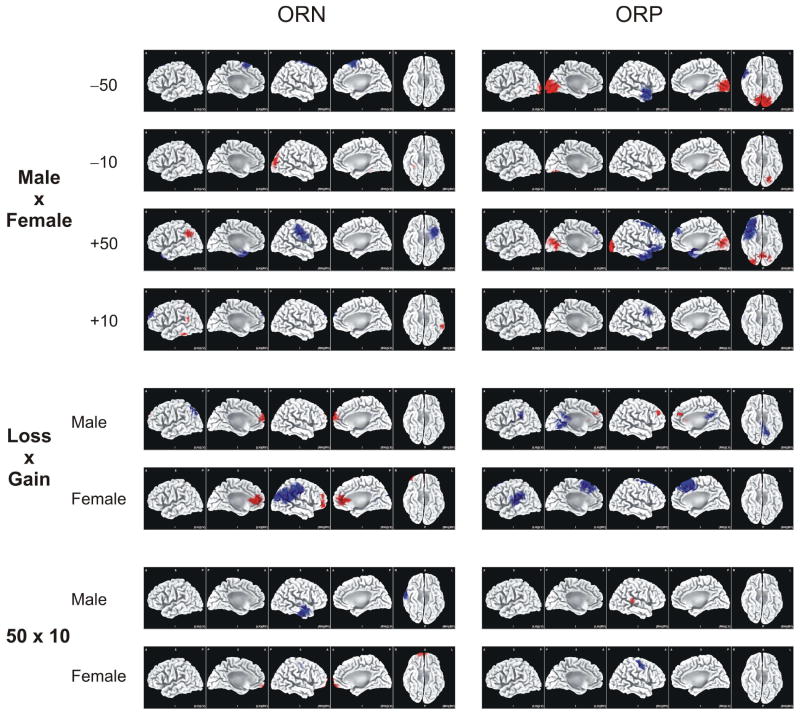
Fig. 9.
LORETA images of voxel-by-voxel t-statistics comparisons between genders and outcomes for the ORN (left column) and ORP (right column). Five views are shown for each comparison: 1) left view of the left hemisphere, 2) right view of the left hemisphere, 3) right view of the right hemisphere, 4) left view of the right hemisphere, and 5) inferior view of both hemispheres. Statistically significant increase and decrease of activity (in the voxels) in the first versus the second of the comparison are represented in red and blue respectively. All the t-values were subjected to Holmes’ correction for multiple comparisons.

