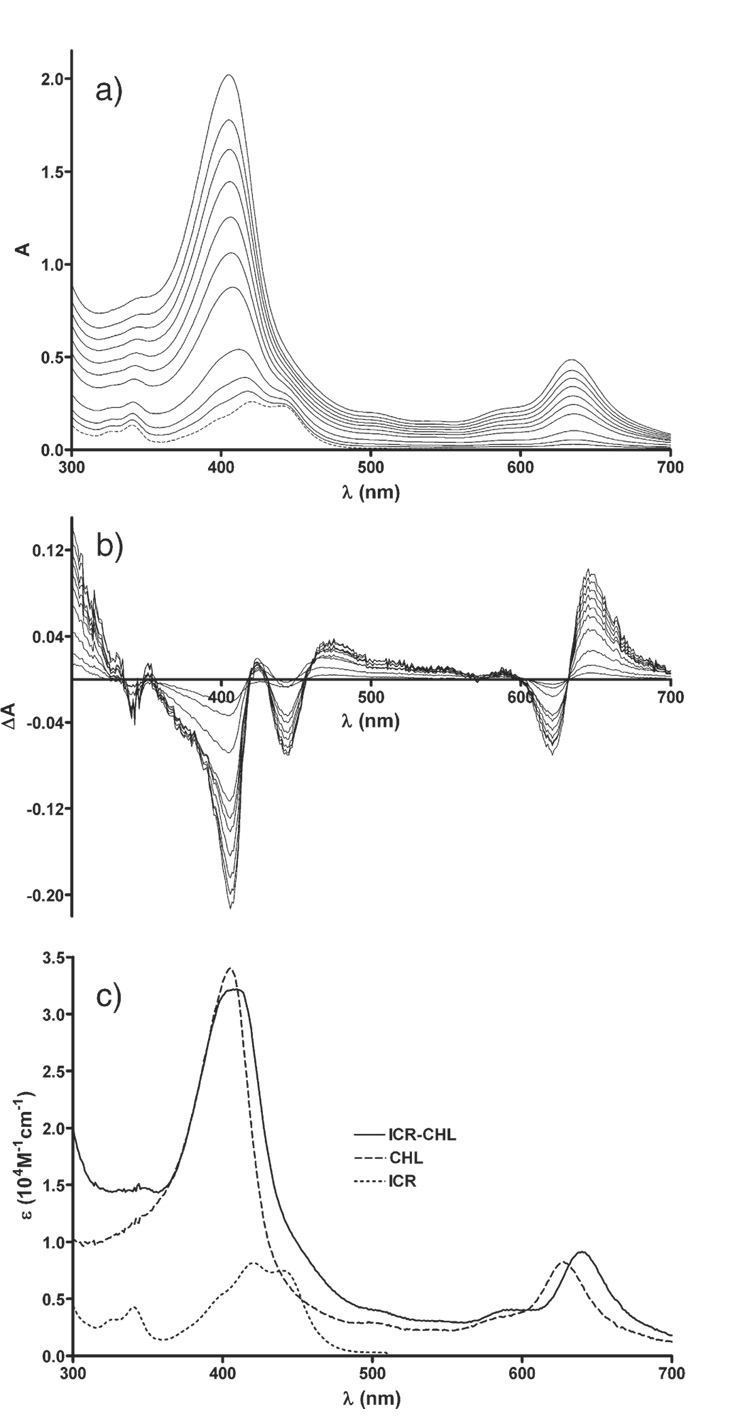
Fig. 1.
a) Absorption spectra of ICR-191 (broken line) and mixtures of ICR and CHL (solid lines), ICR was at 8 µM, while CHL concentration varied from 1 to 20 µM, from bottom to top; l=3 cm; b) respective differential spectra; c) absorption spectra of ICR (dotted line), CHL (dashed line), and computed spectrum of ICR–CHL complex (solid line).

