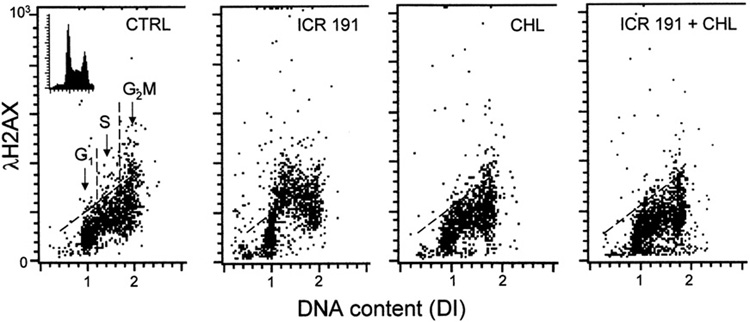
Fig. 5.
Protection of DNA in HL-60 cells by CHL from the damage induced by ICR-191. The bivariate (DNA content versus expression of γH2AX) distributions (scatterplots) illustrating effect of ICR alone (1.2 µM), CHL alone (1.0 µM), and ICR (1.2 µM) together with CHL (1.0 µM), on phosphorylation of histone H2AX (expression of γH2AX). Based on differences in cellular DNA content the cells in G1, S and G2M phases of the cell cycle can be identified as shown in the left panel. Note an increase in expression of γH2AX detected immunocytochemically and measured by flow cytometry, particularly of the S-phase cells, upon treatment with ICR alone. This increase was prevented when the cells treated with ICR and CHL (right panel). CHL alone had no effect the level of H2AX phosphorylation. The skewed threshold lines show maximal level of γH2AX expression for 95% interphase untreated (CTRL) cells.

