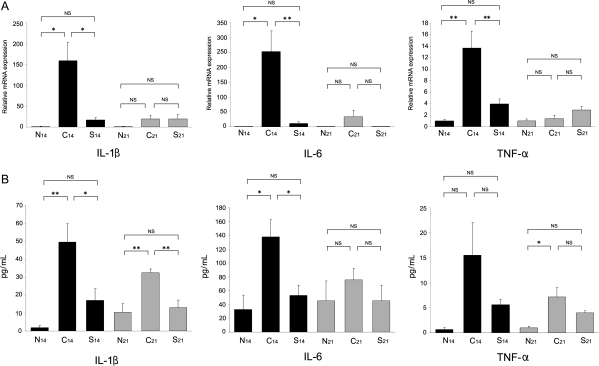
Figure 5.
Effect of recombinant S100A8/A9 on proinflammatory cytokines: mRNA expression in EAM heart and serum concentrations. (A) Total RNA was extracted from the heart and real-time RT–PCR analysis was performed. Bar graphs show relative mRNA expression of IL-1β, IL-6, and TNF-α. *P < 0.05, **P < 0.01. (B) Serum IL-1β, IL-6, and TNF-α concentrations were determined using an ELISA method. The Y-axis represents the concentrations of each proinflammatory cytokine. *P < 0.05; **P < 0.01.

