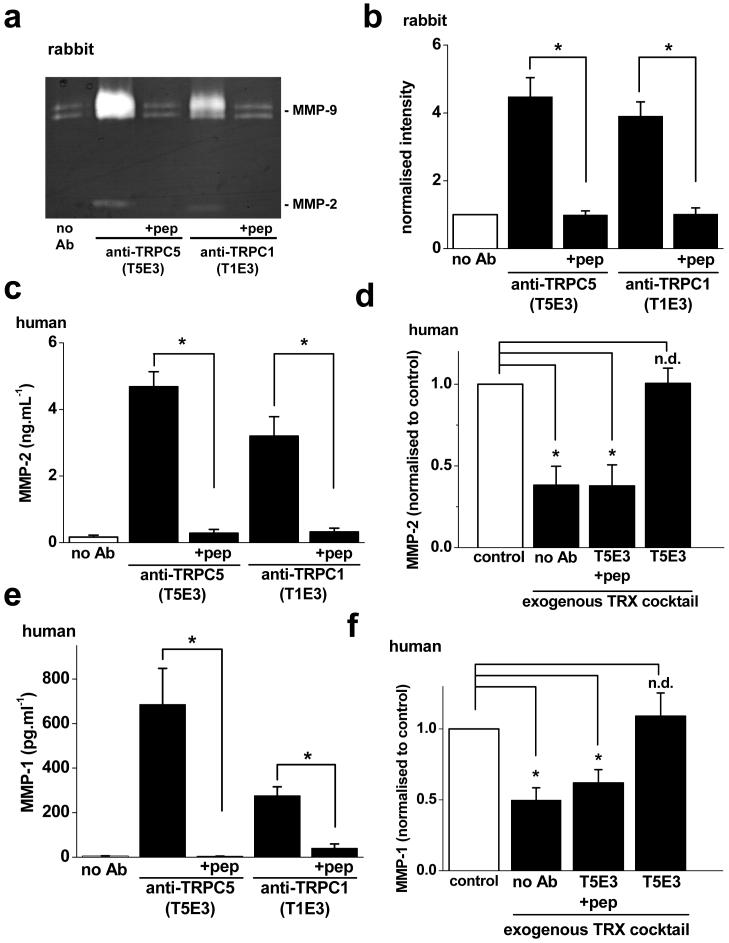
Figure 4. Relevance to secretion from FLS cells.
a, Zymogram showing MMP-9 (pro and active) and MMP-2. b, As for a but mean data after normalisation of MMP-9 band intensity to the no antibody control group (n=3 each). c, ELISA data for MMP-2 (n=4). d, Effect of T5E3 (n=4) on inhibition of MMP-2 secretion by exogenous TRX cocktail. For each group secretion in TRX was normalised to that in its absence (control). e, f, As for c, d but for secretion of pro-MMP-1.

