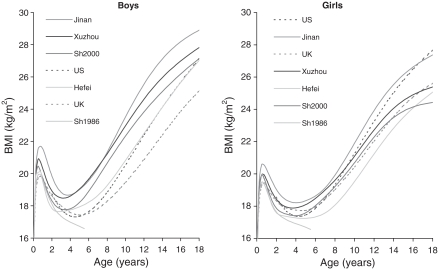
Figure 2.
The 91st centiles of BMI in boys and girls by age. Jinan, Xuzhou, Shanghai 2000; Hefei, Shanghai 1986 (solid lines), US CDC 2000 and British 1990 (dashed lines). To help distinguish between the curves, the ordering of the legend matches the ordering of the curves at age 18 (age 6 for Shanghai 1986).

