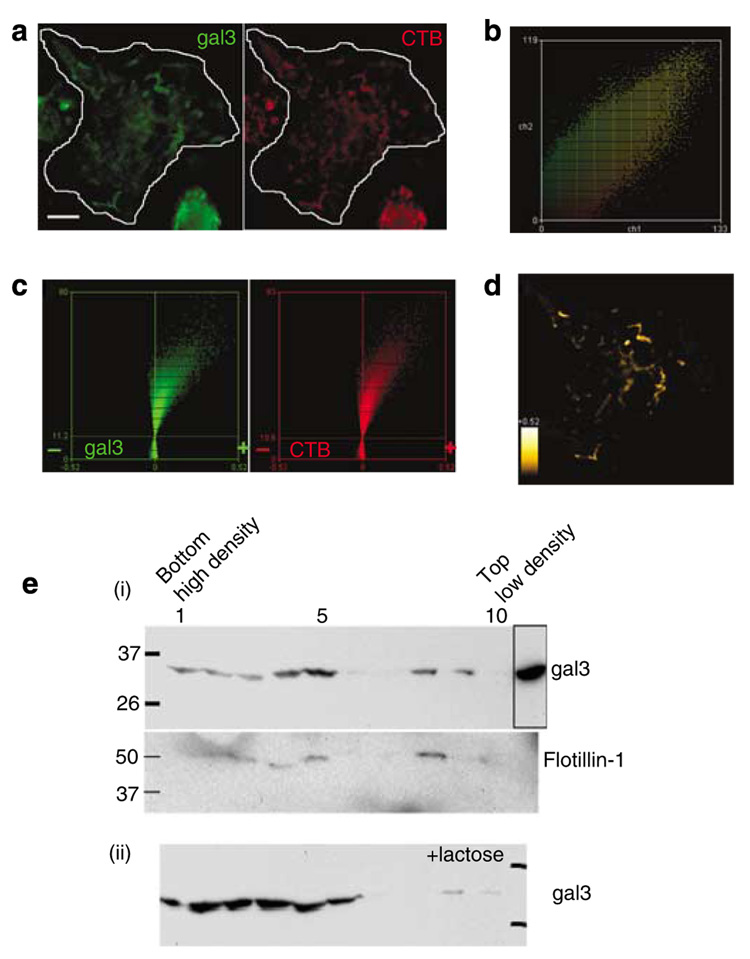
Figure 7. Galectin-3 is present in lipid rafts of mouse dendritic cells.
BMiDCs were induced with fibronectin and fMLP as in Figure 6. (a) Cells were incubated with Alexa555-labeled CTB at 12 °C, followed by fixation, permeabilization, and development for fluorescence detection of intracellular galectin-3 as in Figure 6. Micrographs were acquired with a × 60 objective (NA 1.2) at intervals of 0.5 µm and deconvolved as described. Projection images shown are contrast enhanced to improve visualization. The bar represents a distance of 10 µm. (b) Diagonal distribution of galectin-3 (green) and CTB (red) staining of all optical planes from unenhanced images of the field depicted in (a) indicates co-dependent pixel intensities. (c) Intensity correlation analyses of thresholded unenhanced images show pronounced positive skewing of PDM (product difference of the means; see Materials and Methods) values for galectin-3 and CTB, indicative of significant co-localization. (d) Regions of the cell demonstrating galectin-3 and CTB co-localization from positive PDM guidance in (c) are shown. Heat scale, PDM values 0 to +0.52. Image is contrast enhanced to improve visibility. Results are representative of two experiments. (e) Immunoblots for galectin-3 from fMLP-activated J774A.1 macrophages homogenized in cold Triton X-100 buffer and fractionated on sucrose gradients. Equal protein loads from each fraction were processed for detection of specific proteins (i) galectin-3, absence of lactose, and the lipid raft marker flotillin-1; and (ii) galectin-3, presence of 100mm lactose in the sucrose gradient. High- to low-density fractions appear from left to right, and the boxed region represents unfractionated cell lysate. Size markers in kilodaltons are shown. These results are representative of three experiments.

