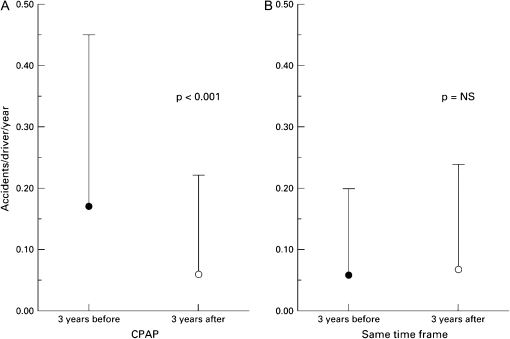
Figure 1.
Average (±SD) number of automobile crashes per driver per year over the 3-year interval before initiation of positive airway pressure therapy (solid circles) and during the 3-year interval after initiation of positive airway pressure therapy (open circles) in (A) patients with sleep apnea–hypopnea compared with (B) control subjects over the same time periods. Reprinted by permission from Reference 18.

