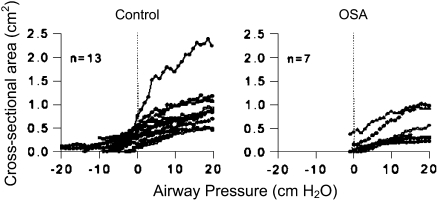
Figure 2.
Static airway cross-sectional area versus pressure curves at the level of the soft palate for a series of children with obstructive sleep apnea (OSA) (right) and control subjects (left). The closing pressure defined as zero area is higher in OSA. Modified by permission from Reference 31.

