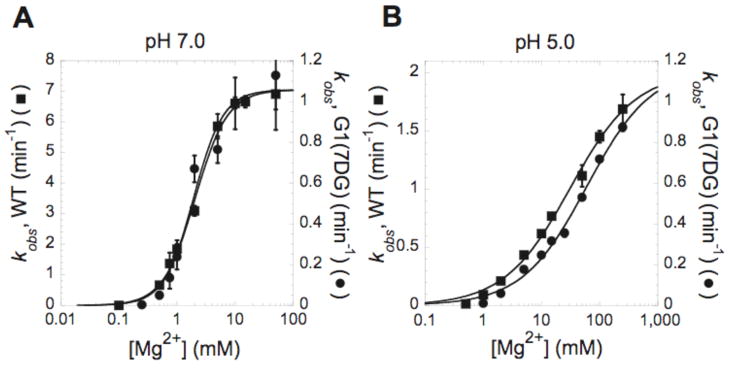
Figure 3.
Effect of 7-deazaguanosine on Mg2+ affinity is apparent at pH 5.0. Plots of kobs as a function of MgCl2 at (A) pH 7.0 and (B) pH 5.0. The cleavage reaction was performed at 37 °C in 25 mM Tris-Cl pH 7.0 or 25 mM sodium acetate pH 5.0. In each plot, the scale for kobs measured with the WT substrate (■) is shown on left Y axis, and the scale for kobs measured with the G1(7DG) (●) is shown on the right Y axis. Each point is the average of at least two independent experiments and the standard deviation is shown as error bars. Data were fit to equation 2. The resulting kinetic parameters are provided in Table 1.

