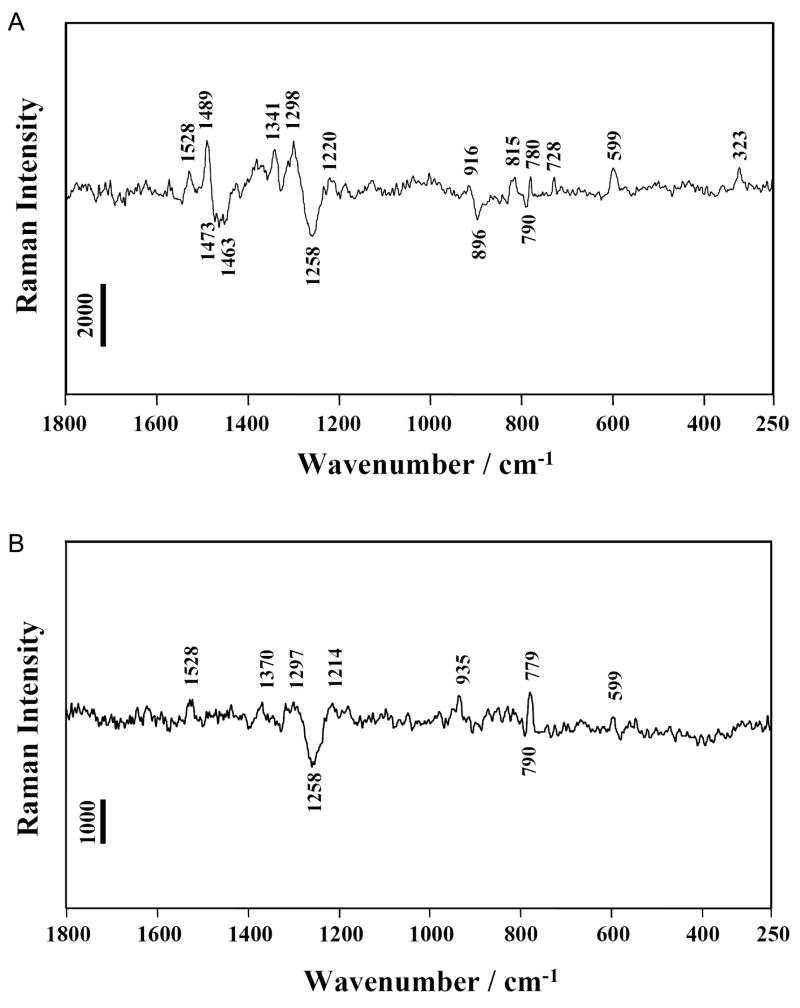
Figure 4.
Raman difference spectra. (A) [HDV pH 7.5] minus [HDV pH 5.0] (B) [HDV(G1(7DG)) pH 7.5] minus [HDV(G1(7DG)) pH 5.0]. The HDV ribozyme crystal was surrounded by cacodylate buffer pH 7.5 or acetate buffer pH 5.0 containing 20 mM Mg2+. Experimental details were described in previous Raman studies(17). Peak assignments are provided in Table S1. Vertical bars represent photon events.

