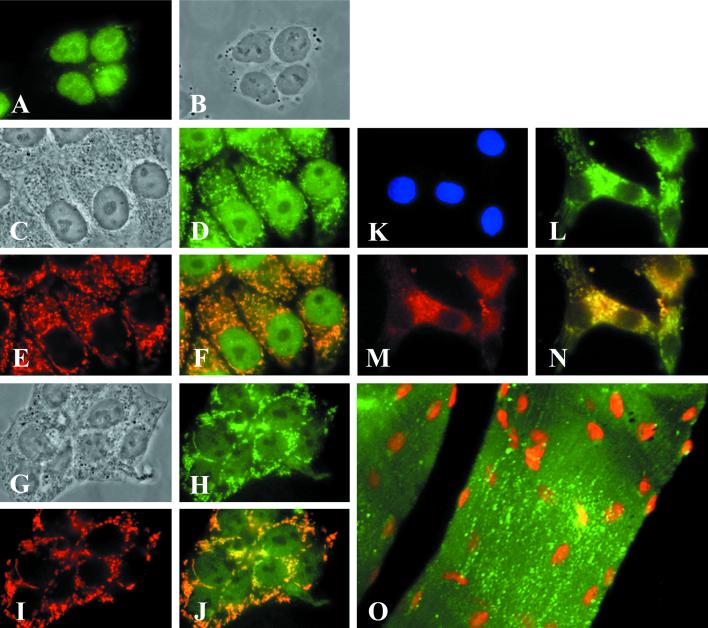
Figure 2.
Determination of the mitochondrial localization of ACC2 by fluorescence microscopic analysis. HepG2 cells (A−F), T47D cells (G−J), and neonatal rat cardiomyocytes (K−N) were plated separately at a density of 2 × 10⁵ on glass coverslips coated with polyamino acids. After 48 h of incubation in medium containing 10% bovine serum, the cells were fixed in 3.7% formaldehyde and then immunostained with preimmune serum (A) or ACC2 antibodies and mAbs raised against mitochondria-specific protein as a marker (D, E, H, L, and M). The cells were visualized by reacting them with the goat anti-mouse IgG-TXRD conjugate for the mitochondrial proteins (red) or with the goat anti-rabbit IgG-FITC conjugate (green) for ACC2. (B, C, and G) The images were visualized by phase-contrast microscopy and clearly show the nuclei and cytoplasm of the cells. (F, G, and N) Composite images, respectively, of D and E, H and I, and L and M. The overlapping regions in F, G, and N are yellow. (O) Mouse skeletal muscle tissue that was immunostained with ACC2 antibodies and was visualized by reacting it with the goat anti-rabbit IgG-FITC conjugate (green). The nuclei of the skeletal muscle cells were stained with 0.5 μg of propidium iodide. (K) Neonatal rat cardiomyocytes were counterstained with DAPI.

