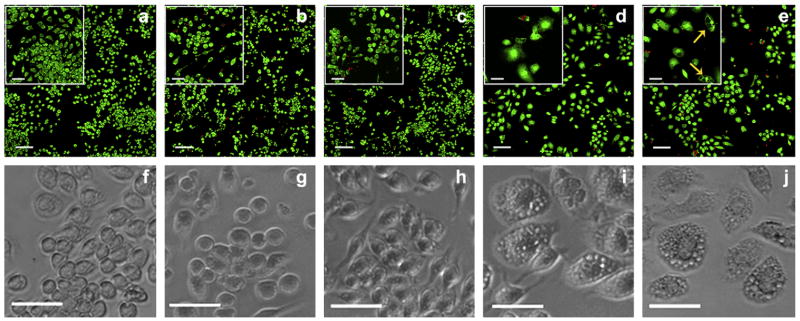
Fig. 4.
Cellular viability and morphology of J774 macrophages after 48 h cultured on: (a, f) TCTP control; (b, g) 2 wt% MAX1 hydrogel; (c, h) 1 wt% MAX8 hydrogel; (d, i) TCTP control + 1.25 μg/mL LPS; and (e, j) TCTP control + 5 μg/mL LPS. Top panels (a–e): LSCM images showing live/dead assays, scale bar is 100 μm. Inset shows magnification of the cells, scale bar is 50 μm. Green = live cells, Red = dead cells. Bottom panels (f–j): phase-contrast images of the cells showing cellular morphology, scale bar is 50 μm. Yellow arrows indicate the formation of vacuoles, N = 6.

