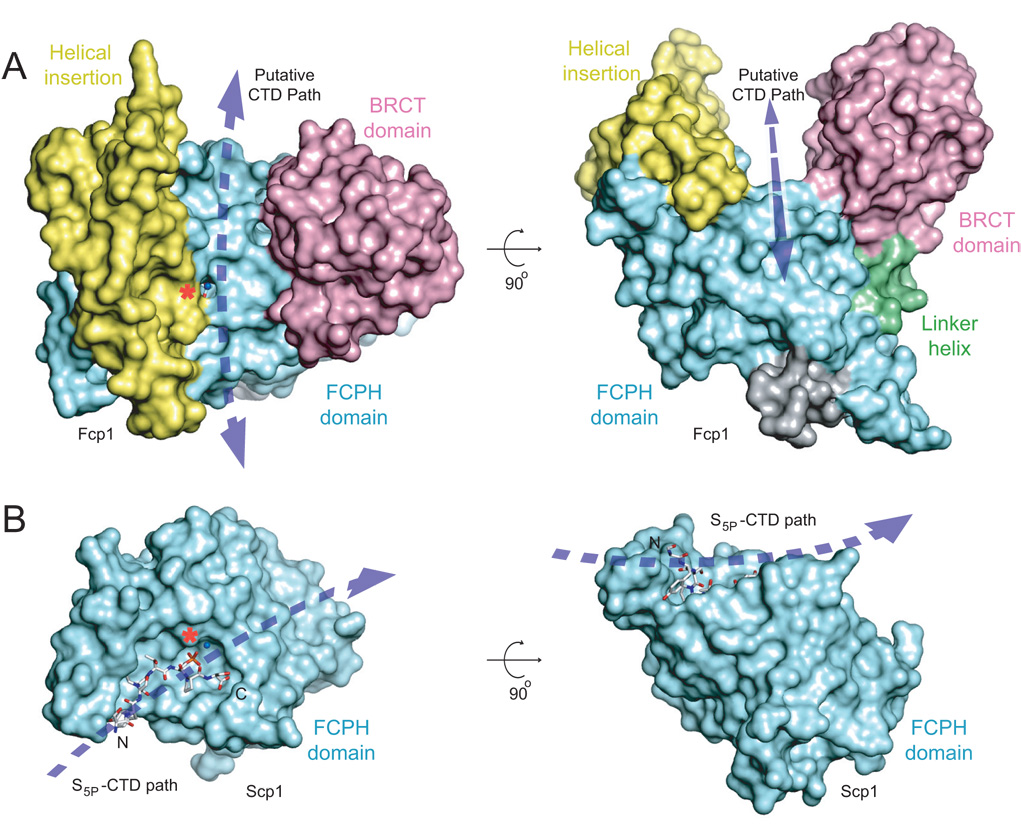
Figure 5. Insights to CTD recognition.
A) Surface representations for SpFcp1 with domains colored as in Fig. 1. A red asterisk indicates the active site Asp170-BeF3-Mg. Proposed CTD path through the Fcp1 canyon indicated by a dashed line. B) Surface representation for the Scp1-CTD complex (Zhang et al., 2006; PDB 2GHT) aligned to SpFcp1 in A. The S5P-CTD ligand is depicted as a stick model with its N and C termini labeled. The dashed arrow indicates the CTD path on the Scp1 surface.

