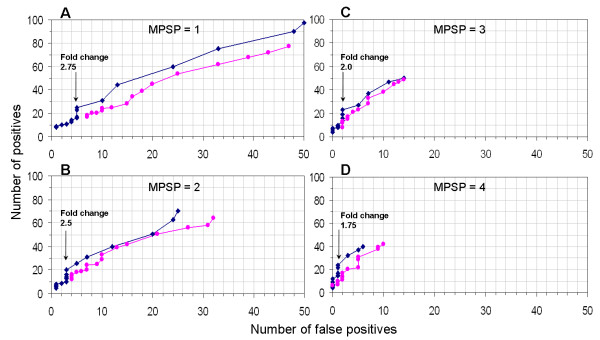
Figure 6.
ROC analysis. The ROC curves were generated by varying the fold-change threshold from 1 to 5 with 0.25 increments. Positives and false positives were identified by a combination of three criteria, including a fold-change, a statistical test, and a MPSP. The MPSP was fixed at 1, 2, 3, and 4 in panels A, B, C, and D respectively. The t-test (blue curves) and the Wilcoxon ranksum test (pink curves) were compared in each panel. Both tests were performed at a significance level of 5%. For the blue curves, the arrows indicate an abrupt change in FDR, and the text labels indicate the corresponding fold-change where the abrupt change in FDR occurs.

