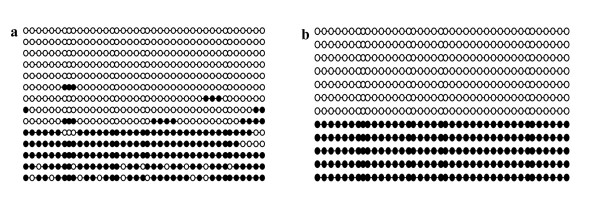
Figure 4.
SNRPN DMR methylation in control samples. DNA bisulfite analysis showing the CpG methylation patterns in the SNRPN DMR of (a) control fibroblast donor cell derived from a day-60 in vivo produced fetus and (b) a 1:1 mixture of paternal (unmethylated)/maternal (methylated) DNA recovered from sperm and oocytes, respectively. Each line represents an individual clone that was sequenced. Black filled circles represent methylated CpG islands, and open circles indicate unmethylated CpG sites.

