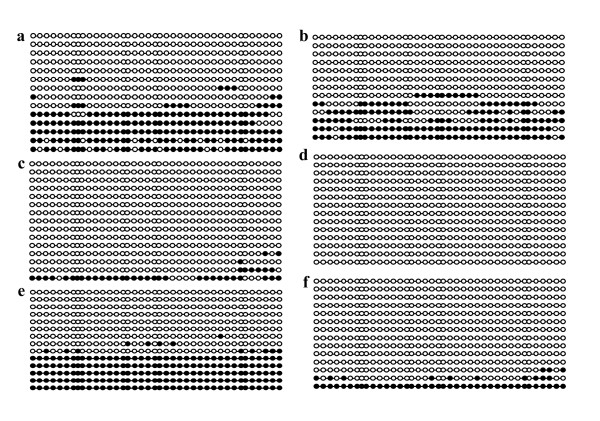
Figure 6.
SNRPN DMR methylation in day-40 tissues. Representative samples of bisulfite methylation analysis of placenta (left column) and brain (right column) of AI (a, b) IVF (c, d) and SCNT (e, f) samples. Each line represents an individual clone that was sequenced. Black filled circles represent methylated CpG islands, and open circles indicate unmethylated CpG sites.

