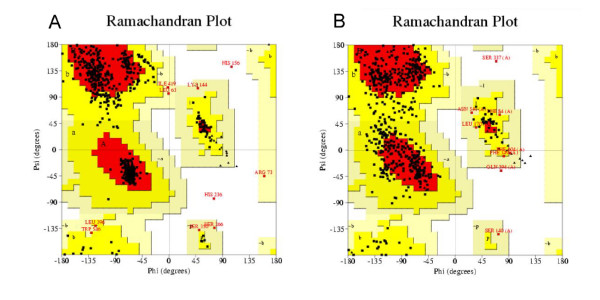
Figure 4.
Ramachandran plot of model and crystal structure of mouse TLR3 ectodomain. (A) Predicted model of mouse TLR3 ectodomain. (B) Crystal structure of mouse TLR3 ectodomain. The different colored areas indicate 'disallowed' (white), 'generously allowed' (light yellow), 'additional allowed' (yellow), and 'most favored' (red) regions.

