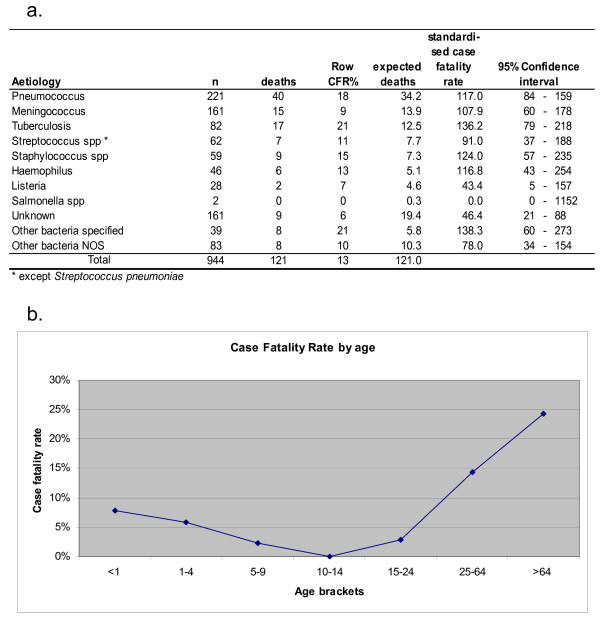
Figure 3.
Bacterial meningitis Case Fatality Rate by aetiological agent and age. The top of the figure reports the row CFR (%) for each aetiological agent, the expected number of deaths according to age-specific death rates for each age bracket, the standardised fatality ratio (i.e. observed deaths/expected deaths*100) and the relative confidence intervals. The graph reports age-specific fatality rates for all meningitis. The category "other" includes unknown aetiology. 2001–2005, Lazio, Italy.

