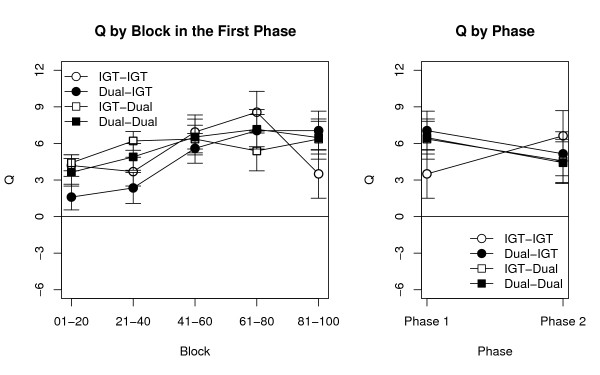
Figure 2.
The Q index across the two phases. Time course of the Q index (tracking the preference for decks with low frequency of losses) for the four groups during the experiment. Left: values of Q during the five blocks of the first phase. Right: A comparison of Q at the end of the first phase and during the second phase, where no feedback was allowed. Points represent mean values ± SEM.

