
Figure 5. High levels of H3 acetylation and H3K4 trimethylation are found at the PD-1 regulatory regions in PD-1 expressing cells.
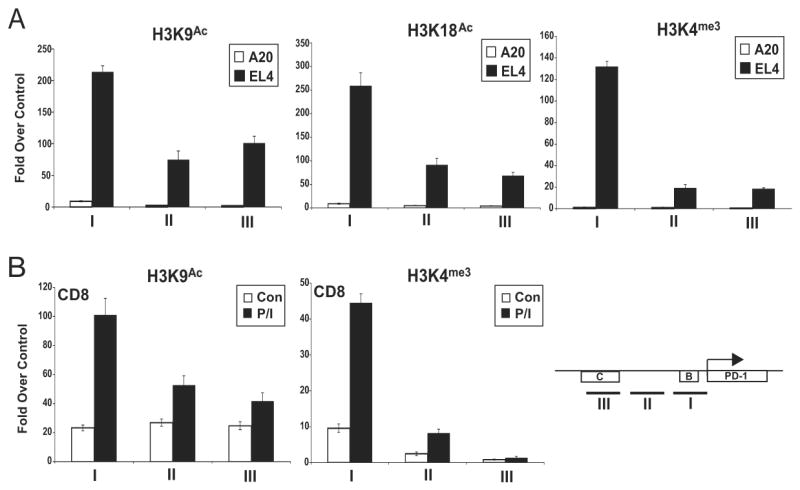
Chromatin was isolated from (A) A20 and EL4; or (B) primary CD8 T cells (Con) and primary CD8 T cells treated with PMA/ionomycin (P/I). ChIP assays were conducted with the indicated antibodies, and quantitative real-time PCR was used to determine the levels of chromatin modifications at CR-B, the intervening region between CR-B and CR-C and CR-C. The locations of the PCR amplicons are shown in the schematic. Quantitative PCR results were normalized to input DNA amounts and plotted as fold over an irrelevant antibody control (anti-TCR). The results presented were the average (-/+ standard error) of three independent experiments.