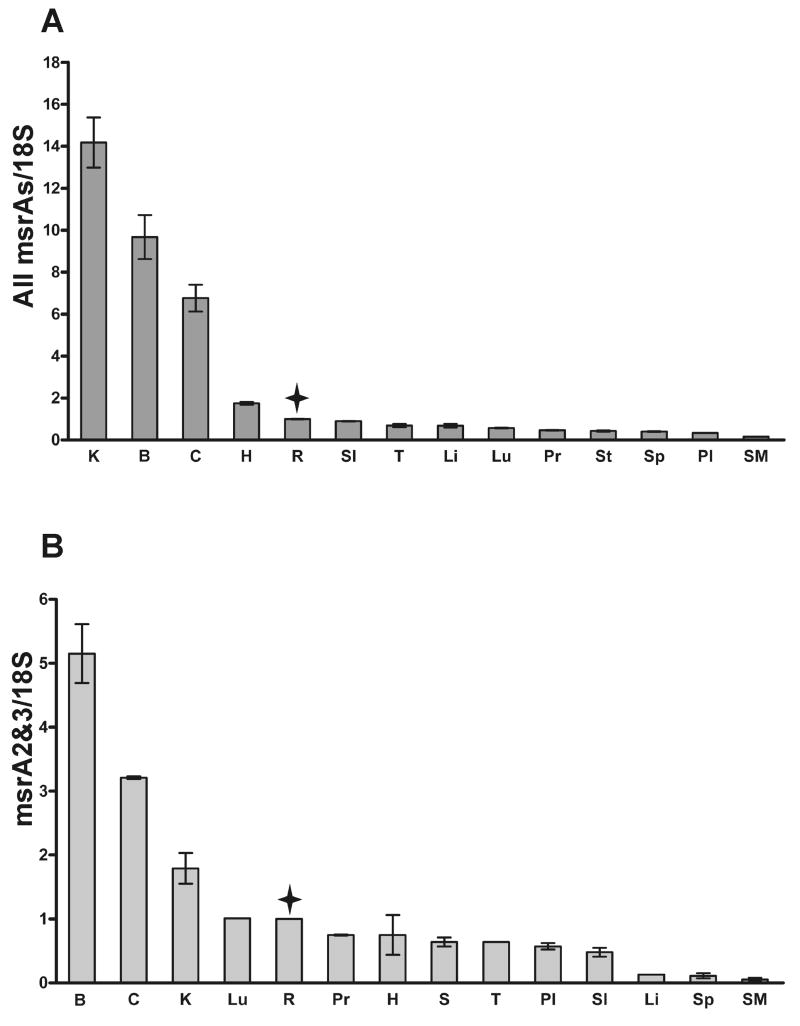
Fig. 1.
Expression of msrA transcripts in different human tissues by qRT-PCR. A. Expression of all msrA transcripts (from promoters 1 and 2, Table 1). B. Expression of msrA2/3 transcripts (from promoter 2). The results are normalized with the 18S ribosomal RNA. Data are presented as the mean of two independent experiments and the error bars are the standard deviation of the individual measurements. A value of 1 was given to the retina. B, Brain; C, Cerebellum; H, Heart; K, Kidney; Li, liver; Lu, Lung; Pl, placenta; Pr, prostate; R, Neural retina; SI, Small Intestine; SM, Skeletal Muscle; Sp, Spleen; St, Stomach; T, Testis. The tissues were aligned from high to low and retina is marked with a star.

