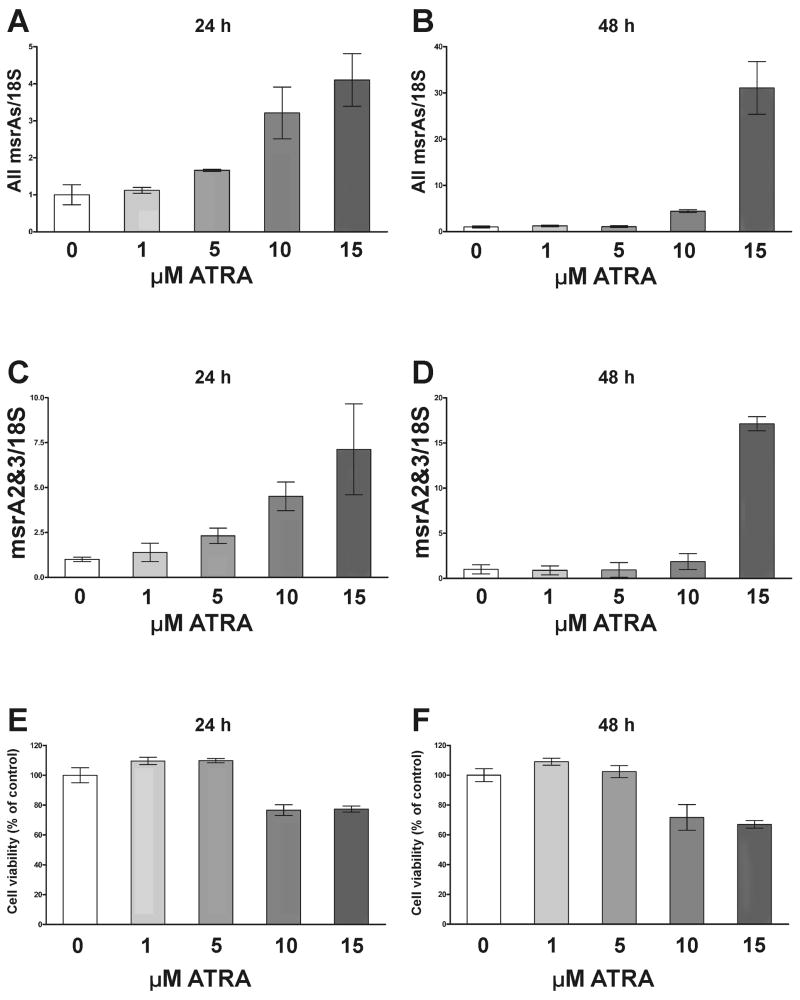
Fig. 10.
Effect of ATRA on the expression of native msrA transcripts. D407 cells were treated with 0, 1, 5, 10 and 15 μM of ATRA for 24 h and 48 h. Expression of msrA transcripts was determined by qRT-PCR using the same primers and conditions as Fig. 1 (Table 1). A. All msrA transcripts (msrA1, 2 and 3) from both promoters. B. MsrA transcripts from promoter 2 (msrA2/3). Cell viability (cellular dehydrogenase) was performed under the same treatment conditions. C. Cell viability 24 h after treatment. D. Cell viability 48 h after treatment. Values were normalized to the 18S ribosomal RNA and related to the control. Data are presented like Mean ± SD of at least three samples.

