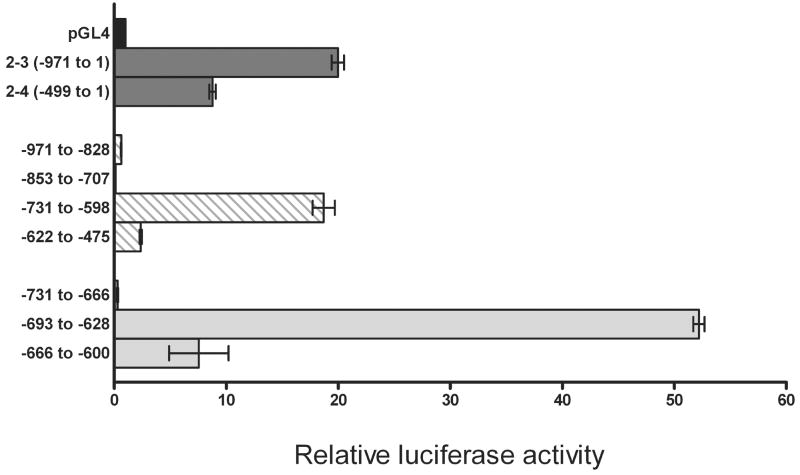
Fig. 4.
Identification of an enhancer region in promoter 2. The promoter 2 region between −971 and −475 was subcloned into 4 regions: −971 to −828, −853 to −707, −731 to −598 and −622 to −475 and the luciferase activity measured in transfected D407 cells (Table 2). The high activity region between −731 and −598 was further subcloned into three smaller constructs: −731 to −666, −693 to −628 and −666 to −600 (Table 3). The empty vector (pGL4) and the 2–3 and 2–4 promoter 2 constructs were used for comparison. Data (Mean ±SD of three measurements) are representative of three or more independent experiments.

