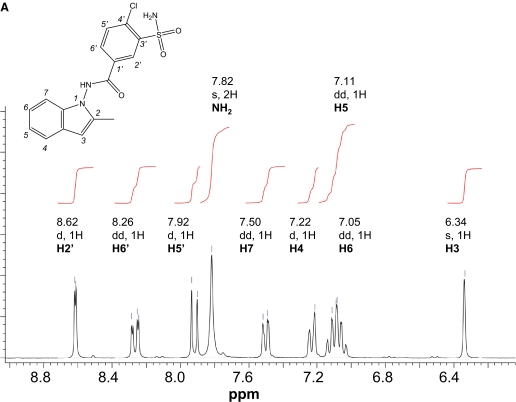
Fig. 1.
NMR spectra of synthetic dehydroindapamide: 1H NMR aromatic region of dehydroindapamide in D6-DMSO (A) and HMBC spectrum showing proton-carbon correlations (B) (1H on the horizontal axis and 13C on the vertical axis) obtained on a Bruker 250-MHz spectrometer. The vertical dotted lines on B at approximately 7.75, 3.38, and 1.40 ppm are instrumental noise.

