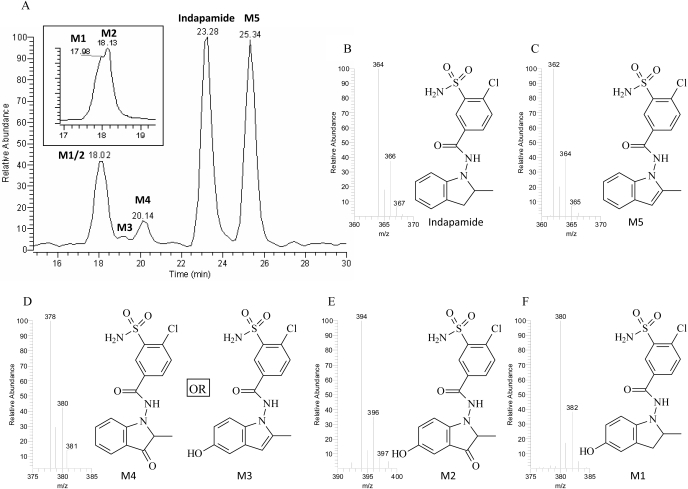
Fig. 3.
Metabolic profiles of indapamide by human liver microsomes or CYP3A4 as determined by MS selected-ion scan (A), HPLC/UV (A, inset, at 250 nm) and LC/MS (B–F). Molecular ions in the negative scan mode [M-H]– for indapamide and its metabolites are as follows: indapamide, m/z 364 (B); M5, m/z 362 (C); M4 and M3, m/z 378 (D); M2, m/z 394 (E); and M1, m/z 380 (F). The isotopic clusters for the molecular ions and M + 2 ions, with approximate ratios of 3:1 (M/M + 2) are characteristic of the presence of chlorine. These clusters are observed with each metabolite.

