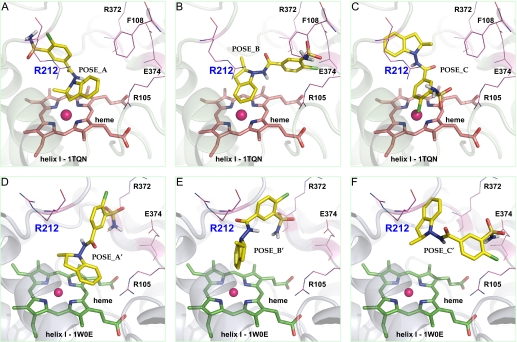
Fig. 6.
Molecular models of indapamide in the active site of CYP3A4 predicted by AutoDock. Conformations generated by Autodock are clustered at RMSD = 2.0 according to their docking energies. The lowest energy docking clusters (POSE_A, POSE_B, and POSE_C for template 1TQN; POSE_A', POSE_B', and POSE_C' for template 1W0E) were selected and illustrated using PyMOL: conformation POSE_A and POSE_A' showing the dehydrogenation orientation at the indoline C-3 position (A and D), conformation POSE_B and POSE_B' showing indoline aromatic hydroxylation or epoxidation orientation with the C-4 and C-5 atoms closest to the heme iron (B, E), and the metabolic inactive state with either the chlorosulfamoylbenzene ring closest to the heme iron (C) or the whole molecule binding away from heme iron (∼7Å; F). Active site residues Arg105, Phe108, Arg212, Arg372, and Glu374 are also illustrated. CYP3A4 is shown in a ribbon format, iron as a sphere, heme (pink for 1TQN and green for 1W0E) and indapamide (yellow) in color-coded sticks: nitrogen = blue, oxygen = red, chlorine = green, and sulfur = gold.

