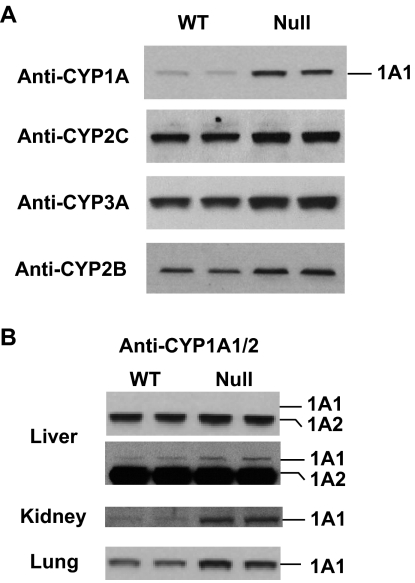
Fig. 4.
Immunoblot analysis of CYP1A, CYP2B, CYP2C, and CYP3A protein expression. A, microsomal proteins from the enterocytes (10 μg) of WT or IE-Cpr-null (Null) mice were loaded in duplicate and analyzed on immunoblots with use of anti-CYP1A, anti-CYP2B, anti-CYP2C, or anti-CYP3A antibodies (as indicated). B, microsomes from the liver (2 μg), lung (10 μg), and kidney (10 μg) were analyzed for CYP1A expression. The positions of CYP1A1 and CYP1A2 proteins are indicated for the liver: two films, exposed either briefly (top) or for an extended time (bottom) to the same blot, are shown to illustrate the induction of CYP1A2 (top) and CYP1A1 (bottom).

