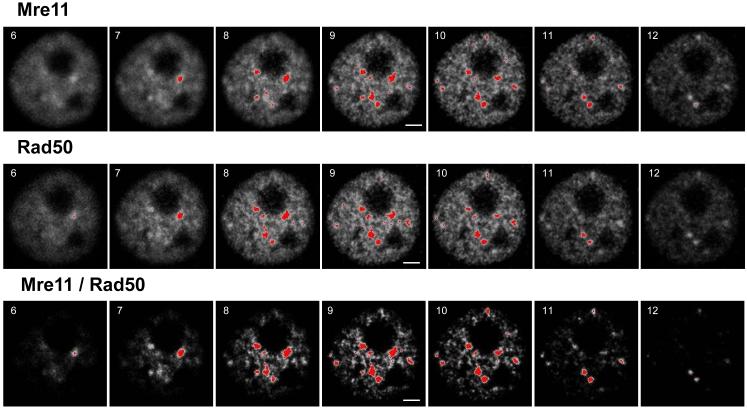
Figure 1.
Composite image of the nucleus of one of the human U-1 melanoma cells that were irradiated (6 Gy of X-rays), then incubated at 37 °C for 4 h, fixed/permeabilized, and immunostained for Mre11 and Rad50 proteins, as described in Materials and Methods. Each slice has the number in its left-top corner, which indicates the sequence within z-series collected from top to bottom. Fluorescence intensities are shown in 8-bit gray format. Both Mre11 and Rad50 are abundant proteins in the nucleus, but are absent in nucleoli (top and middle panels, respectively). The foci are shown in red with a threshold boundary set at 175 for both sets of images. The bottom panel shows the 8-bit images of positive PDM values (that mainly represent the enhanced foci) derived from image correlation analysis between these two sets of images (top panel vs. middle panel). After the enhancement of foci, the threshold boundary was readjusted to 220 to reduce their size (threshold level value of 175 that was adjusted for “Mre11” and “Rad50” sets of images is too low for “Mre11/Rad50 sets of images, since it results in the remarkable enlargement of foci leading to their fusion). Scale bars = 3 µm.

