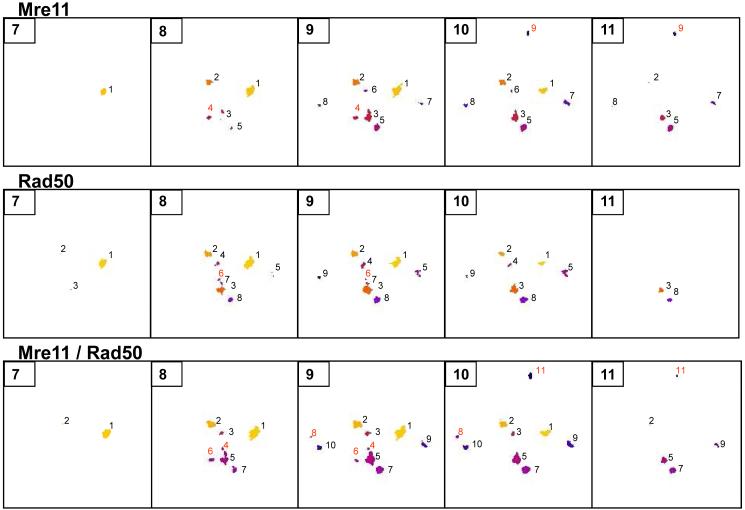
Figure 2.
3D objects analysis. Three sets of images shown in Figure 1 (“Mre11”, “Rad50”, and “Mre11/Rad50” sets of images) were subjected to this analysis. The spots represent foci. Each spot has its own number and color that allow tracking of foci through the entire stack of images. Numbers shown in red indicate the spots missing in one of the two sets of images (“Mre11” or “Rad50”), or in both sets of images (“Mre11” and “Rad50”). A 10-voxel size threshold was set to exclude the objects having sizes ≤ 10 voxels.

