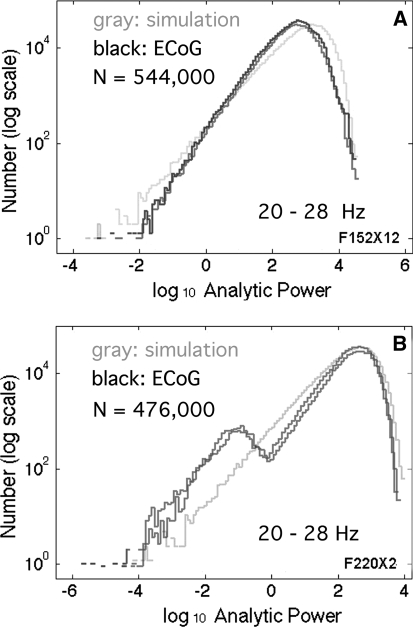
Fig. 3.
a The histograms of log10 analytic power, A2(t) (dark curves), which came from rabbit and human ECoG that had power-law PSD (Fig. 1a, c), closely conformed to the histogram (light curve) from black noise generated from random numbers. b Histograms from ECoG (dark curves) with PSD that deviated from power-law (Fig. 1b) deviated from the histogram (light curve) of black noise. Deviations occurred at either high, low, or both ends of the distributions

