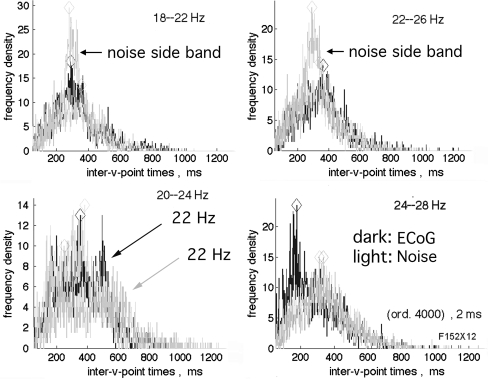
Fig. 7.
The Rice distribution in a rabbit ECoG centered at 22 Hz was simulated with either brown or black noise by adding a cosine with frequency fixed at 22 Hz and amplitude 0.02 SD of the white noise before summing. The PSD for the histograms is in Fig. 1a

