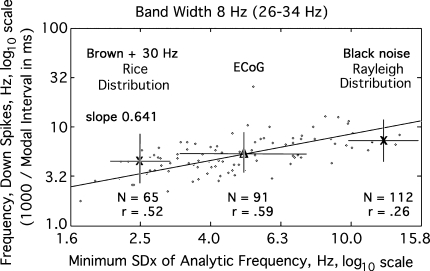
Fig. 8.
The reciprocal of the duration of each interval between down spikes is expressed in Hz and plotted (dots) as a function of the minimal spatial standard deviation, SDXm, of the analytic frequency in Hz (mean Δ), serving as a measure of the intrinsic bandwidth of the oscillations centered at 30 Hz. The slope of the line is 0.641. The variation in SDXm (bars) was greater for ECoG than for either brown or black noise (right X). A 30 Hz cosine was added to the brown noise (left X). The modal shift was modeled by adding a sine wave to random noise (Fig. 6; Rice 1950, Sect. 3.10, pp. 104–113)

