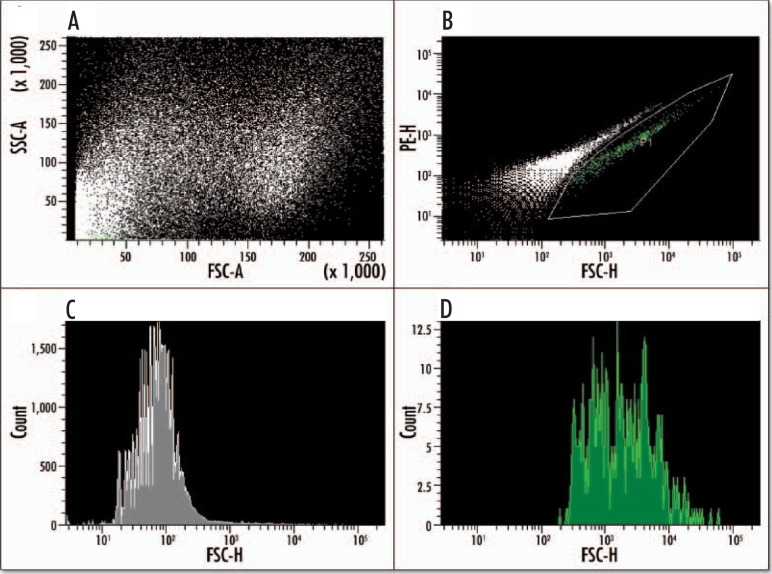
Figure 8.
Fluorescence activated cell sorting (FACS) of EGFP positive cells from an E15.5 pancreas. Dissected pancreases from a litter of transgenic mice were dispersed into a single cell suspension via enzyme digest and sorted based on their EGFP fluorescence. Analysis of the cells' scatter (A) shows two distinct and viable populations. The EGFP-positive population (gated green population) can be sorted (B) from the background population, which is shown as a white diagonal line of events. (C) A histogram analysis of the purified EGFP-negative population (gray). (D) A histogram of the purified EGFP-positive population (green).

