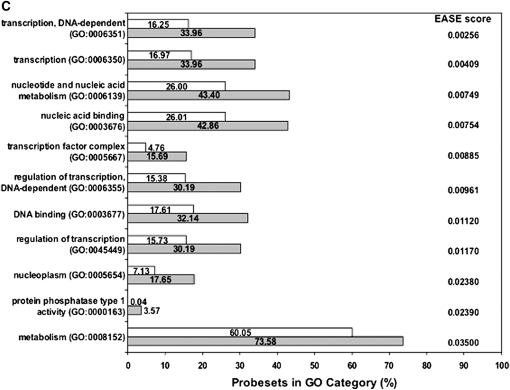
Figure 5.
Gene ontology analysis. Ontologic categories significantly (EASE score < 0.05) overrepresented in (A) discrete, (B) quantitative, or a (C) union of COPD biomarkers. Given are GO category name and number, the percentage of genes within the category (plotted, with value) and the EASE score for the category. Open bars, all genes tested; shaded bars, COPD biomarkers.


