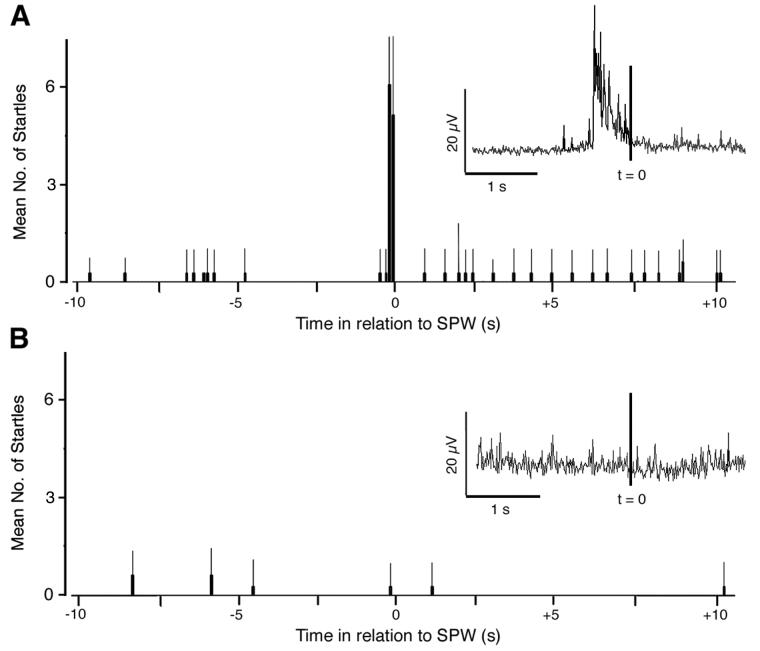
Figure 2.
(A) Peristimulus histogram of mean (+ s.e.) number of startles, determined from EMG records and triggered by SPWs, in intact and head-fixed P1-4 rats (n = 4). The inset shows the averaged nuchal EMG amplitude in relation to the peak of a SPW (t = 0; vertical line). N = 92 SPWs. (B) Same as in (A) accept pups were decerebrated before testing (n = 6). N = 83 SPWs. The inset figures are produced by averaging nuchal EMG after downsampling to 250 Hz.

