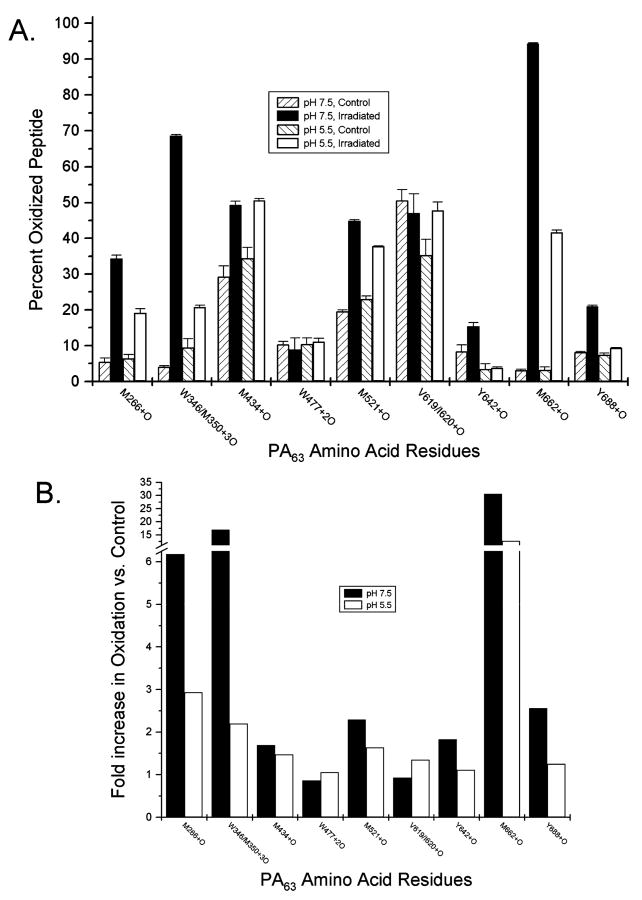
Figure 2.
Quantitative analysis of oxidation from ESI-MS. The amount of peptide oxidation was calculated for each PA63 amino acid found modified by MS/MS analysis. For each oxidized peptide under each experimental condition, the signal abundance of both unoxidized and oxidized ions was recorded, each in triplicate. (A) Data are expressed as the percent total oxidized peptide [oxidized/ (oxidized + unoxidized) × 100], and error bars represent the calculated standard deviation. (B) The increase in the level of oxidation for indicated PA63 residues was calculated by dividing the percent total oxidized peptide after irradiation by that of control samples. Shown are representative data for each of the amino acids in this study for which quantitation of oxidation was carried out.

