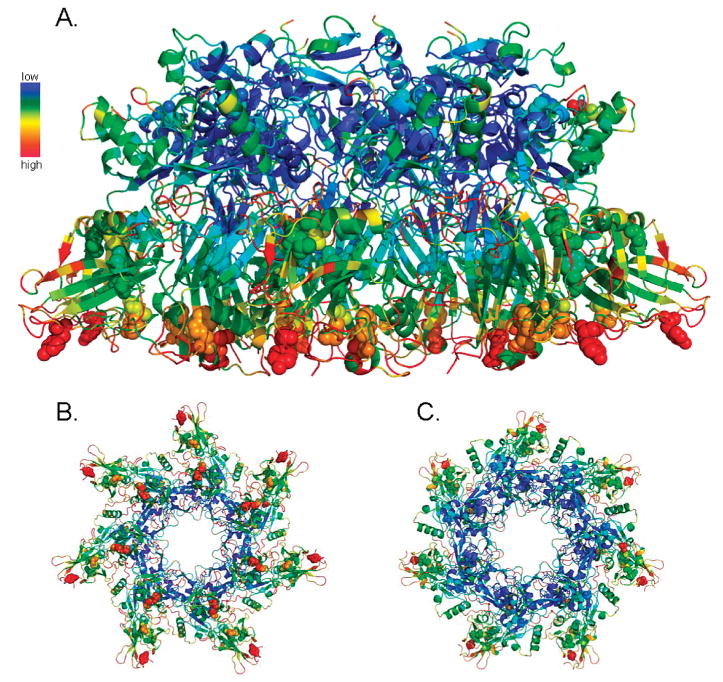
Figure 4.

Anisotropic temperature factors of the PA63 prepore heptamer. The atoms of the PA63 prepore crystal structure [PDB entry 1TZO (17)] are colored on the basis of their anisotropic temperature factor. The spectrum from blue to red represents atoms with low to high b-factor values, respectively, relative to all atoms in the PA63 prepore structure. Sites identified to be oxidized in this study are represented as spheres. Depicted in this figure are side (A), bottom-up (B), and top-down (C) views of the prepore heptamer.
