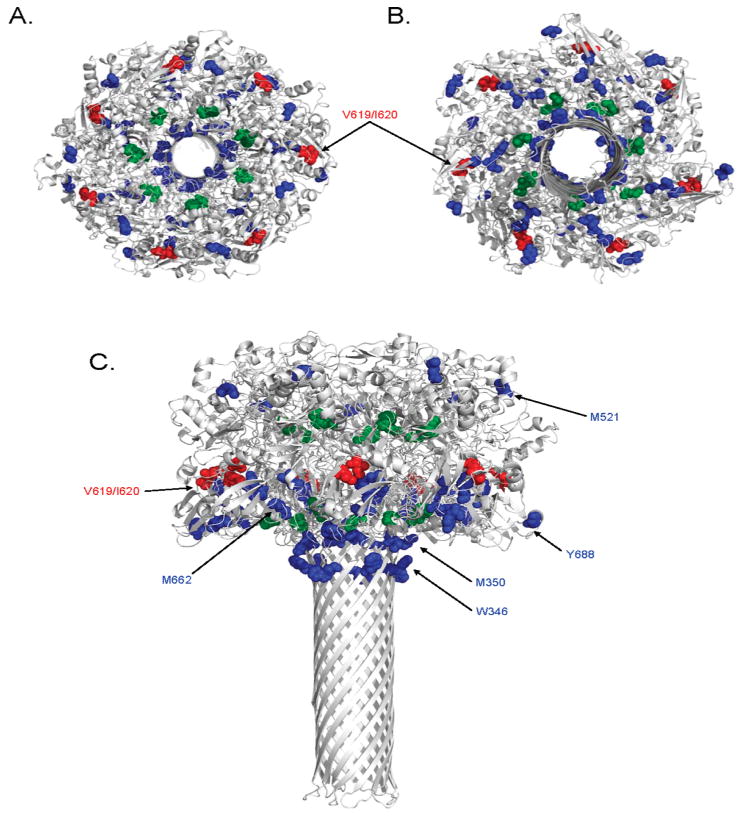
Figure 5.

Mapping oxidized residues on the PA63 pore model. Amino acids found to be oxidized in this study are shown as colored spheres on a ribbon rendering of three-dimensional model of the PA63 pore heptamer [PDB entry 1V36 (47)]. Residues observed to be oxidized more readily at pH 7.5 are colored blue, residues found to oxidized more readily at pH 5.5 red, and residues which demonstrated no change in oxidation between the two pH values green. Depicted in this figure are top-down (A), bottom-up (B), and side (C) views of the pore heptamer.
