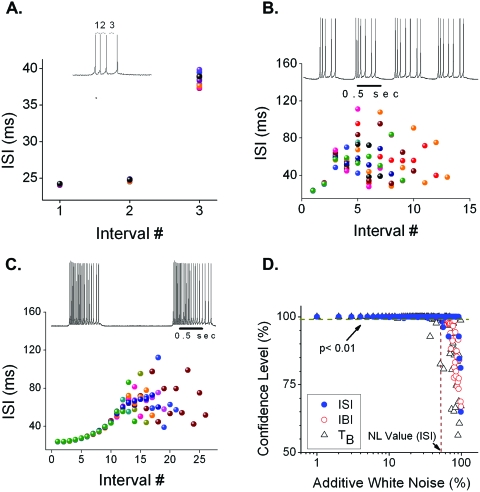
Figure 5. Chaotic ISIs revealed by on-chip simulations of minimal pacemaker model with varying ionic parameters.
(A) Short bursts showing a decrementing firing pattern as indicated by a plot of ISI vs spike interval # (defined in inset). Each color represents a different burst in the same run. (B) Longer bursts showing highly irregular ISIs that quickly diverged from burst to burst. (C) Even longer bursts showing the ISIs’ sensitive dependence on their initial conditions. (D) Results of noise limit (NL) test for chaos (Poon and Barahona, 2001) for simulation shown in (C) The corresponding NL values (indicated by vertical dotted line) averaged over three runs for IBI series, ISI series, and TB series were 68%, 25%, and 37%, respectively with (p<0.01), indicating that all three series were chaotic (see Methods).

