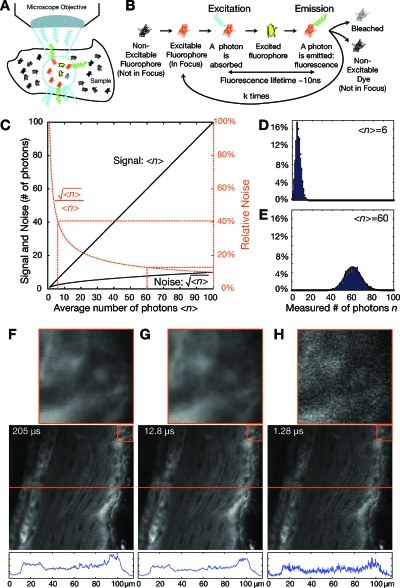
Figure 3. Fluorescence, Poisson processes, and integration time.
(A) In a sample, only fluorophores in the light path and, in particular, in the focus regions are susceptible to be excited and emit photons through fluorescence relaxation. Photons are emitted in arbitrary spatial directions and only photons that are emitted in a direction covered by a cone corresponding to the objective’s numerical aperture contribute to the signal. Photons are subsequently absorbed by the optical system and the detector only captures a select fraction. (B) A single fluorophore that is illuminated can absorb a photon before eventually emitting a fluorescence photon. As long as the fluorophore is illuminated, the cycle can be repeated until the fluorophore is bleached and does not contribute to the signal anymore. A typical number of cycles is 105. (C) The absorption of a photon and the exact time at which a fluorescence photon is emitted is random and can be modeled by a Poisson process. For an average number of emitted photons ⟨n⟩, the variance is . The relative noise decreases as the number of measured photons increases. (D) For a low average count of photons, the variance of the actual measurement is high and (E) proportionally decreases with higher photon counts. (F) In order to decrease the acquisition time, the dwell time (integration time on a single pixel, indicated on slice) must be reduced. (G), (H) As the dwell time decreases, the images appear grainy due to the limited photon count and higher relative fluctuations.

