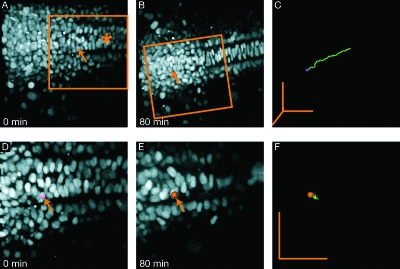
Figure 6. 3D Time lapse imaging of zebrafish embryo injected at one cell stage with H2B-GFP mRNA that marks the cells’ nuclei.
(A)–(C) Data before recursive registration. Global cell motion due to embryo growth makes local cell motion difficult to extract and requires large fields of view. (A) First frame of time-lapse at 11 hpf. The mid-line is visible (asterisk) and one cell has been marked with a spot (arrow). (B) At the end of the time-lapse, the cell marked in A has moved across the field of view. (C) Marked cell track. (D)–(F) After recursive registration the local, relative motions of individual cells can be analyzed. Marked cell is the same as in A. (D) Detail (3D crop) of first frame (approximate location is marked in panel A). (E) Last frame, with global cell motion subtracted (F) Marked cell track. Grid spacing is 10 μm (50 μm scalebars in all directions).

