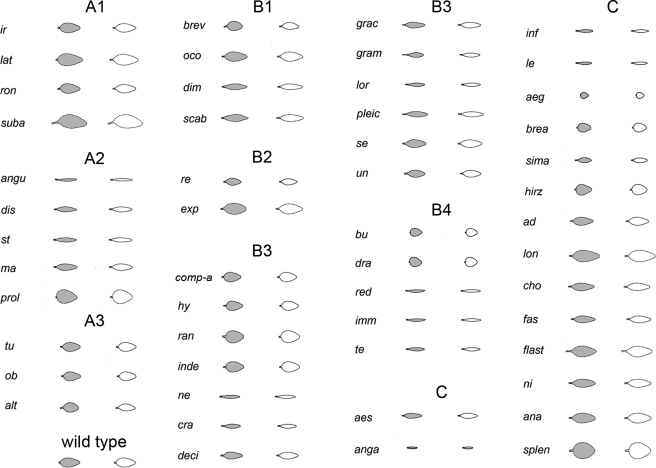
Figure 7. Fifty one Antirrhinum leaf shape mutants reconstructed using highly significant PCs only.
Mean leaf shape as observed (gray) is compared to leaf shape reconstructed (white) using significant (p<0.01%) PCs from the allometry model following a ranked t-test analysis. Wild type (averaged) is shown for comparison.

