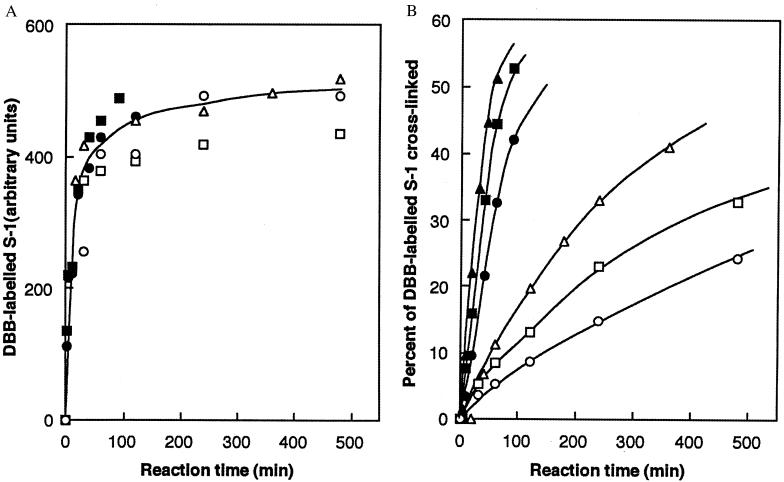
Figure 4.
(A) Fluorescence of S1 (in arbitrary units) acquired by reaction with dibromobimane, depicted as a function of time. The different symbols represent measurements made at various temperatures: open circles, 0°C; open squares, 5°C; open triangles, 10°C; closed circles, 20°C; closed squares, 25°C; closed triangles, 30°C. (B) Percent of dibromobimane-labeled S1 crosslinked (measured by the amount of 105-kDa band that forms on union of the 20-kDa and 50-kDa domains), depicted as a function of time, to show the first-order nature of the reaction. Symbols are as in A.

