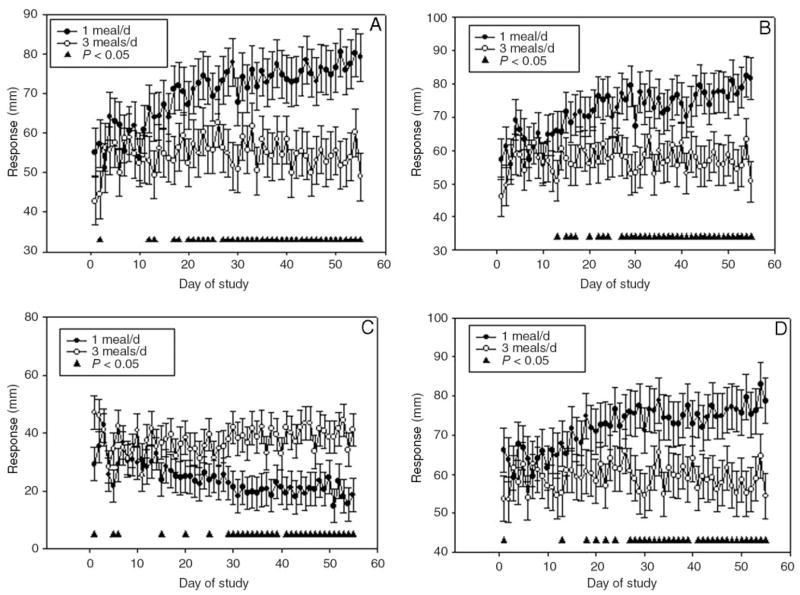
FIGURE 1.
Least-squares x̄ (± SEM) values for subjective ratings of hunger and satiety (A, hunger; B, desire to eat; C, fullness; and D, prospective meal consumption) measured daily by using visual analogue scales (100 mm) during each study period. n = 15 (10 F, 5 M). There was a significant treatment effect between the 1 meal/d and the 3 meals/d diets for all 4 ratings, P < 0.05 (from within-period repeated-measures ANOVA). Significant time × treatment interaction (▲), P < 0.05.

